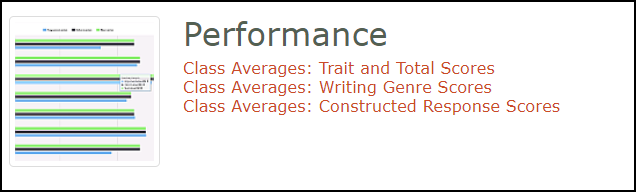
On the Reports tab, the Performance reports allow teachers to keep track of their class's essay scores by writing characteristic and total score and by writing genre, as well as by class average for constructed responses.
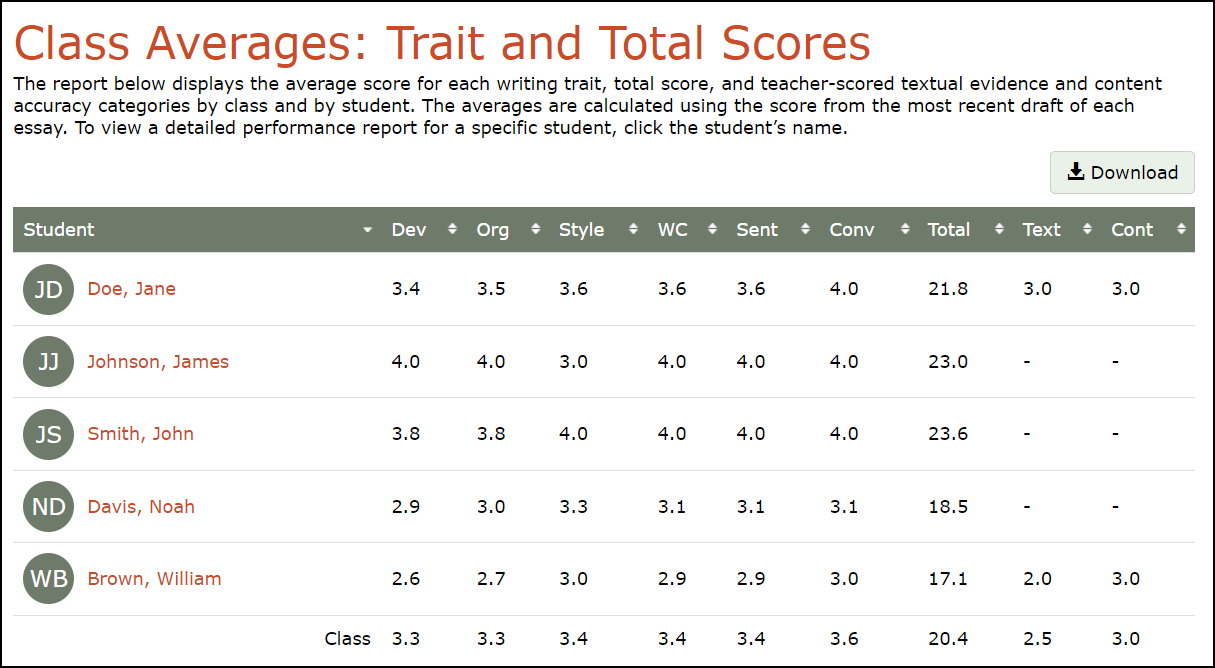
Class Averages: Trait and Total Scores Report
The Trait and Total Scores report displays the average score for the six writing characteristics, the total score, and teacher-scored textual evidence and content accuracy scores, if given, by individual student and by class. The averages are calculated using the score from the most recent draft of each essay. The average scores are based on five points for each of the six characteristics, with a maximum of thirty points total.
Below the table, the average total score data are shown in a chart.
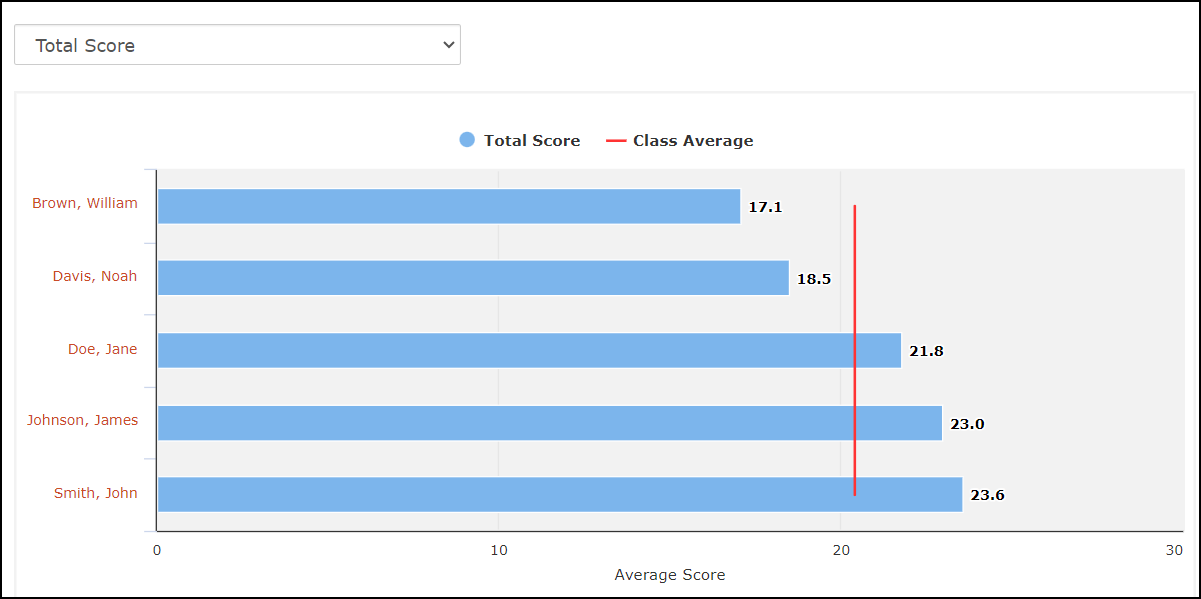
- the vertical red line indicates the average total score for the class, so you can easily see how individual student scores compare to the class average.
- Hovering over the blue bar for an individual student displays the student's average total score compared to the class average total score.
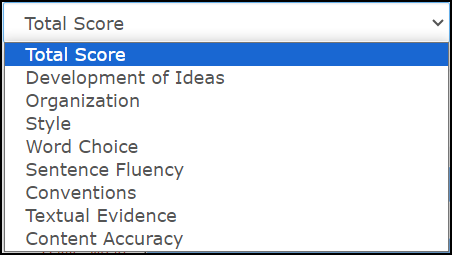
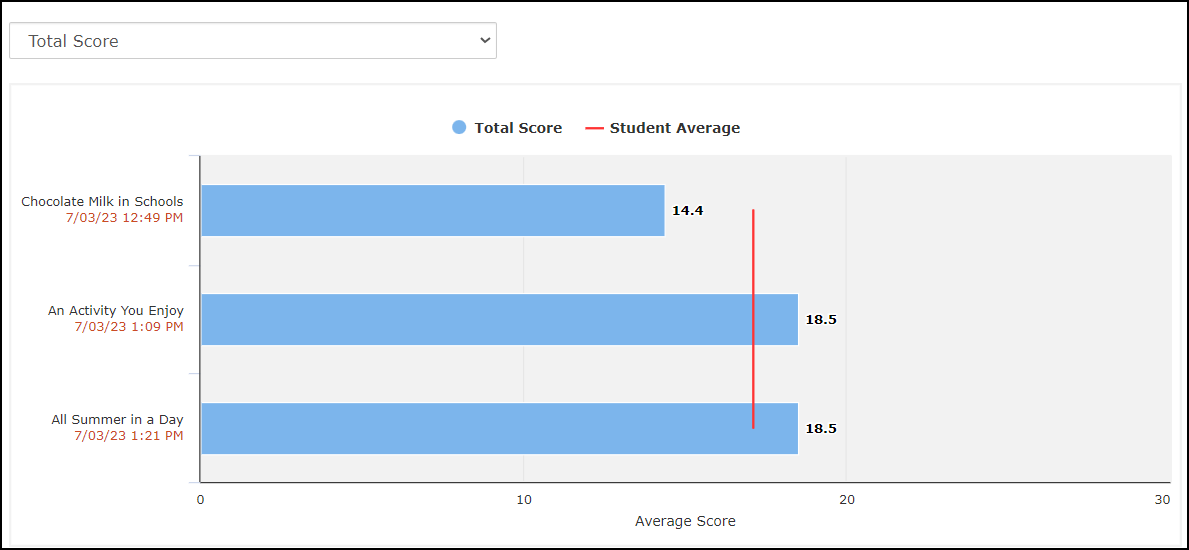
- You can filter the data displayed by clicking on the drop-down menu above the chart and selecting a category, such as a specific writing characteristic.
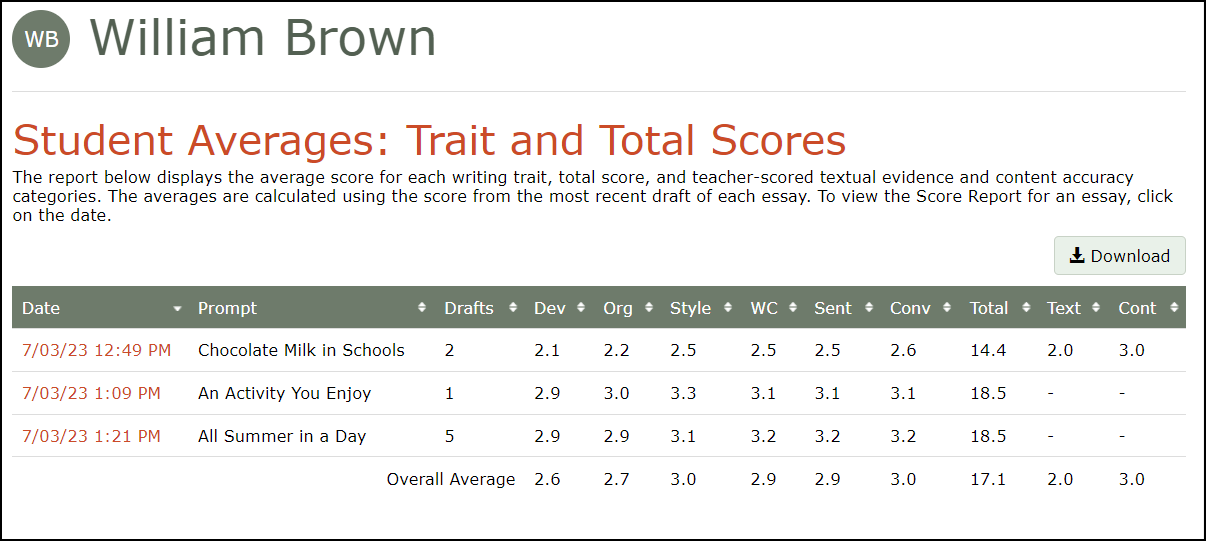
To view a detailed performance report for a particular student, click the student's name in the chart or table. In the Student Averages: Trait and Total Scores report that displays, the student's average scores are shown for each prompt to which the student has responded.
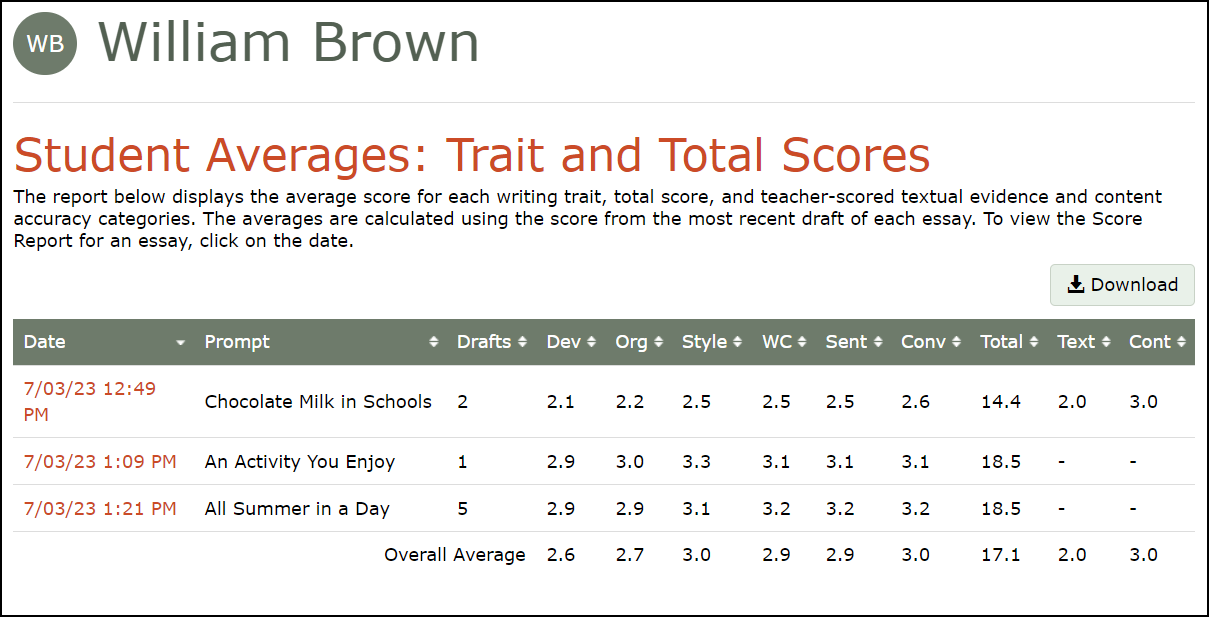
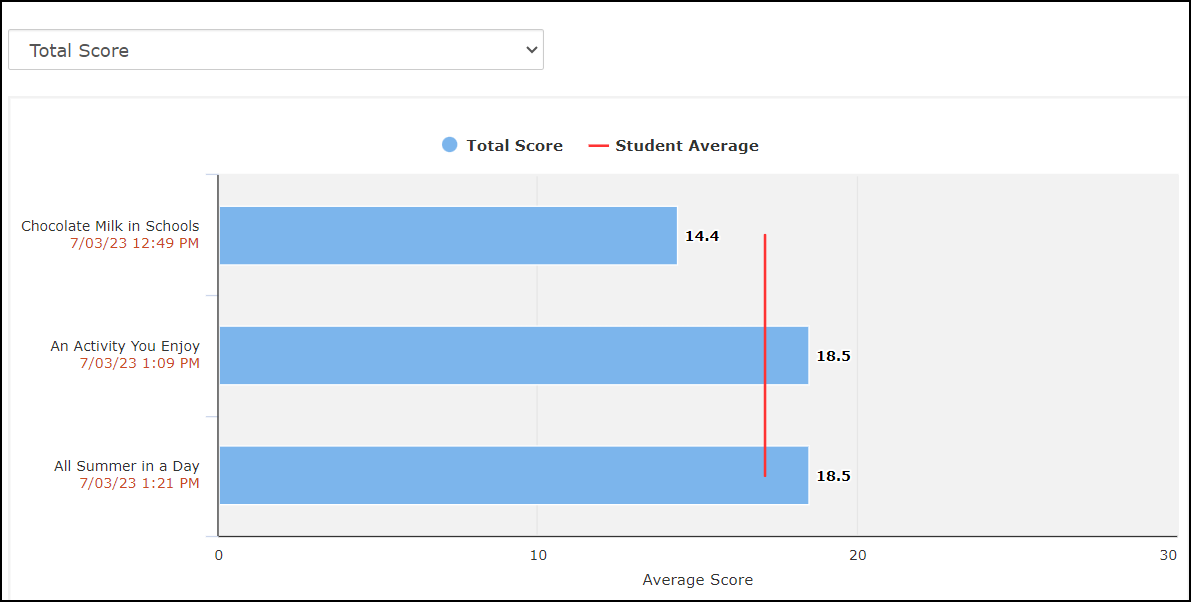
The chart below the table compares the student's average total essay score for each prompt to the student's overall average score, shown by the vertical red line.
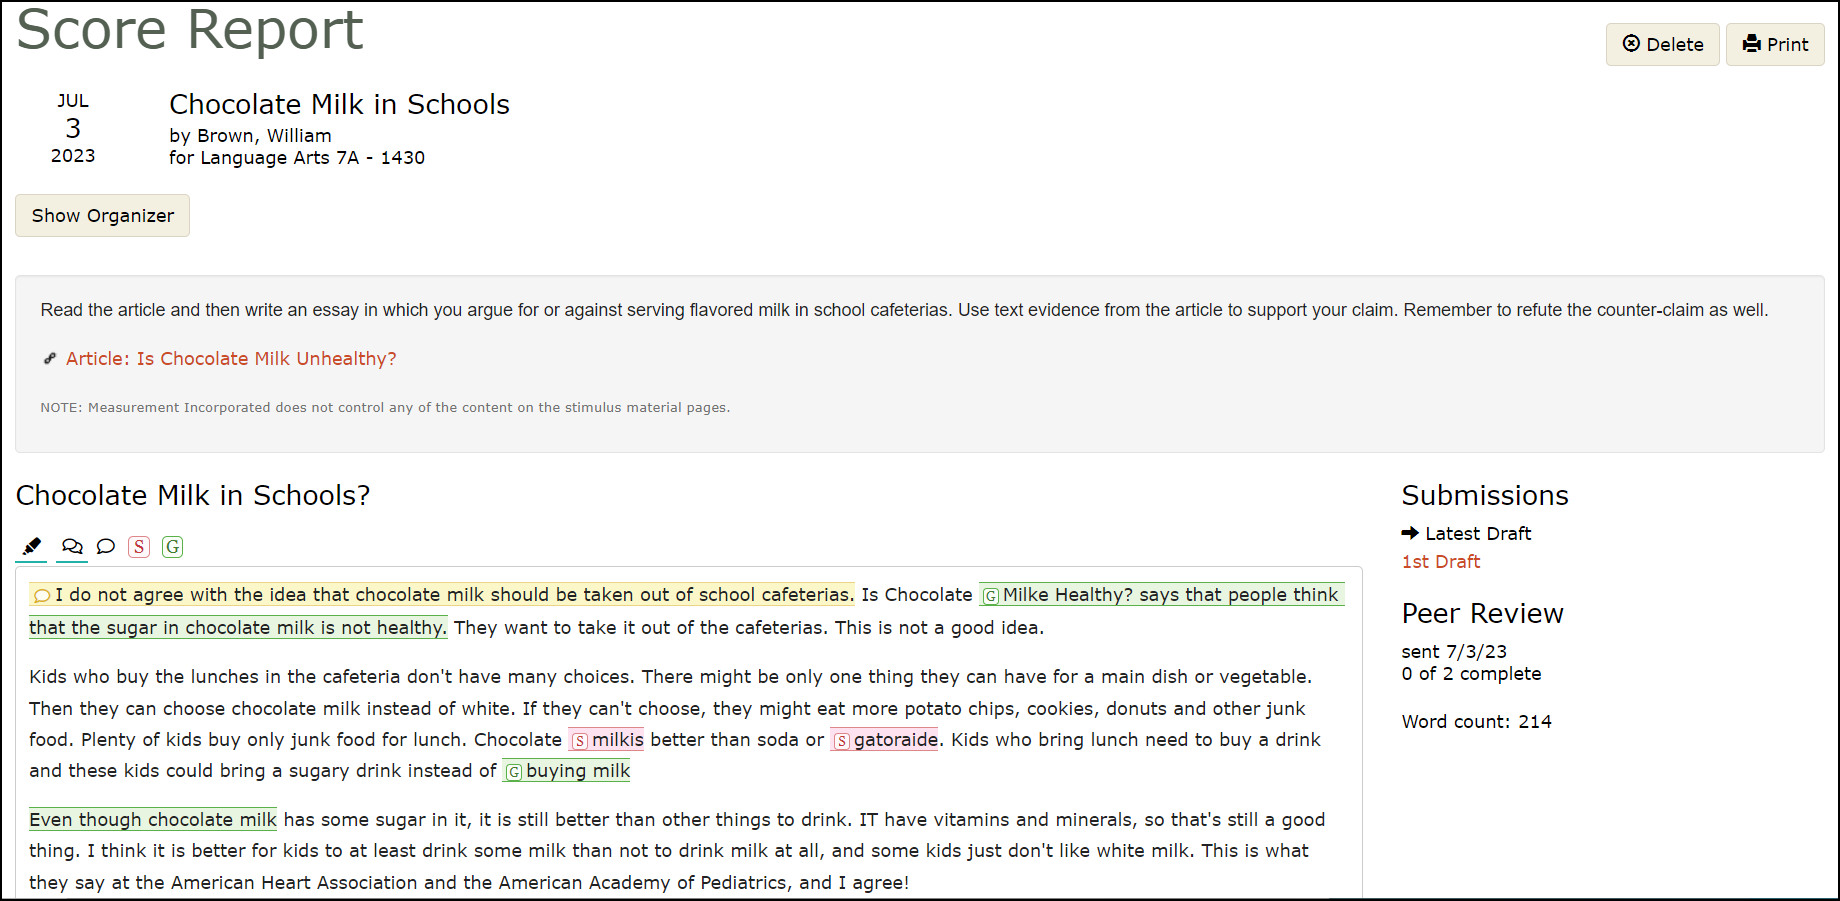
To view the student's Score Report for a particular prompt, click on the date in the table.
Class Averages: Writing Genre Scores Reports
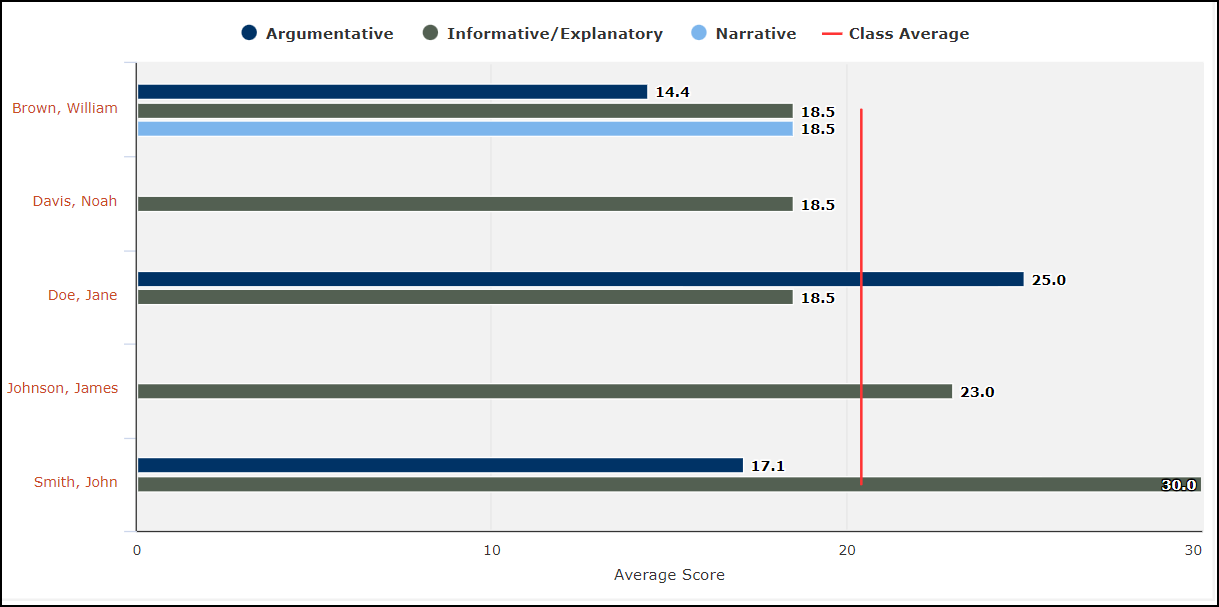
The Writing Genre Scores report compares the average scores on essays written in each specific genre of writing for individual students and the class as a whole.
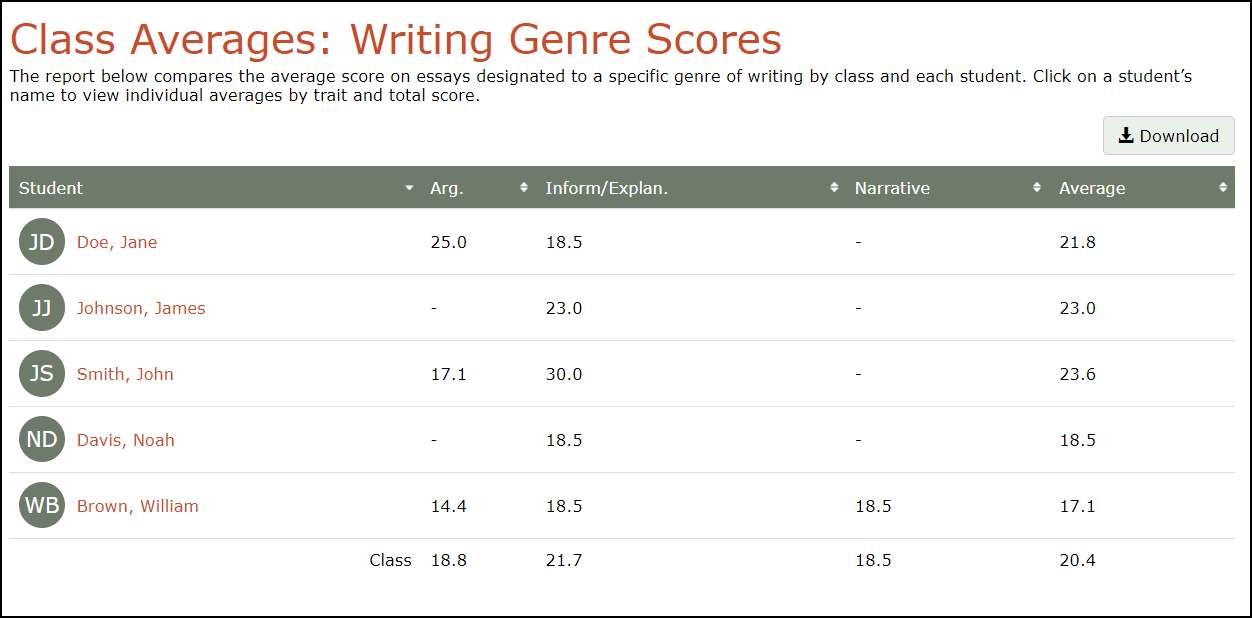
The colored bars in the chart below the table represent the writing genres, and the class average is shown by the vertical red line.
To view the genre score data for a particular student, click the student's name in the chart or table. In the Student Averages: Writing Genre Scores report that displays, the student's average scores are shown for each prompt to which the student has responded in each genre.
The chart below the table compares the student's average total essay score in each genre to the student's overall average score, shown by the vertical red line.
Class Averages: Constructed Response Scores
The Constructed Response Scores report is based on a 3-point rubric. It displays the average holistic score as well as teacher-scored textual evidence and content accuracy scores, if given, for constructed responses.
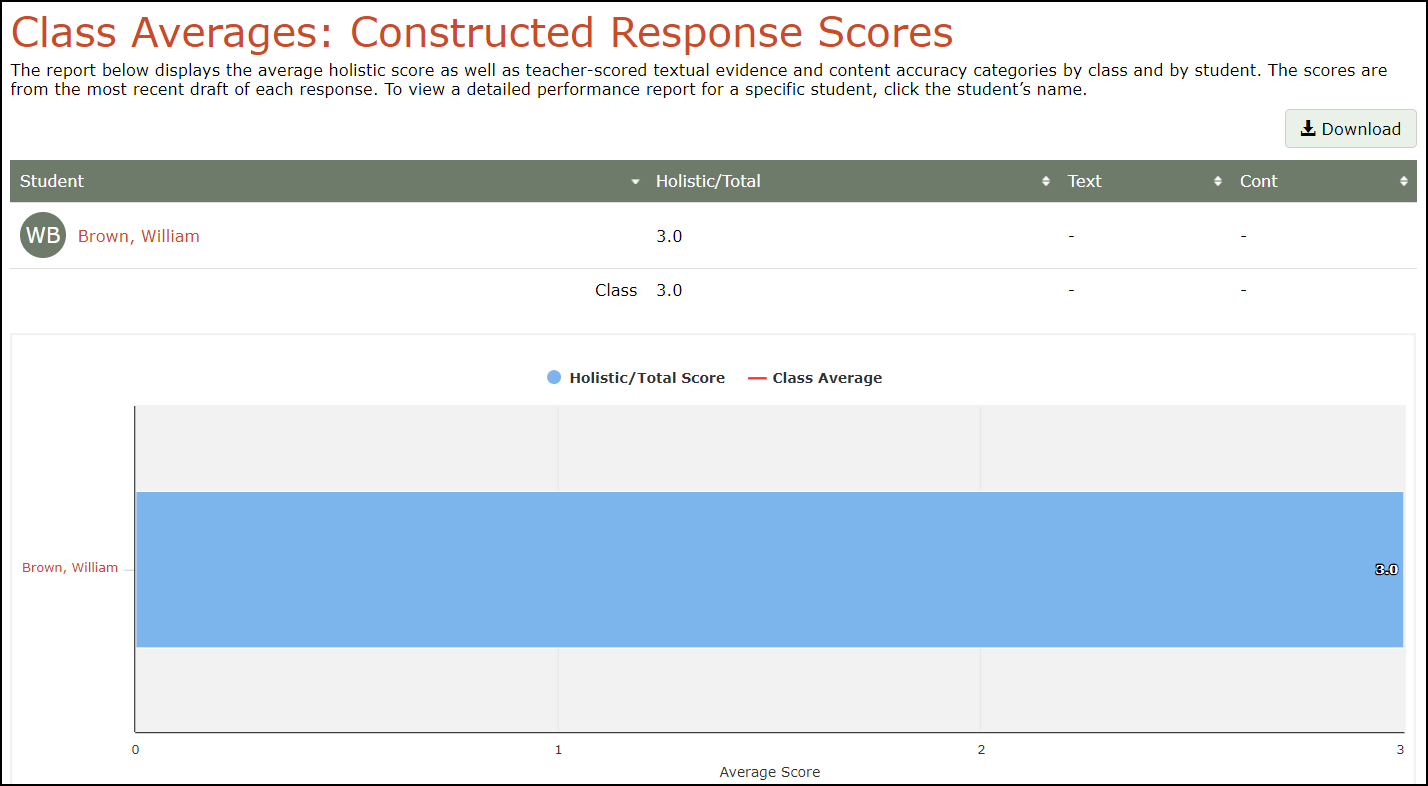
To see an individual student's constructed response report, click on the student's name in the chart or table. In the Student Averages: Constructed Response Scores report that displays, the student's average scores are shown for each prompt to which the student has responded.
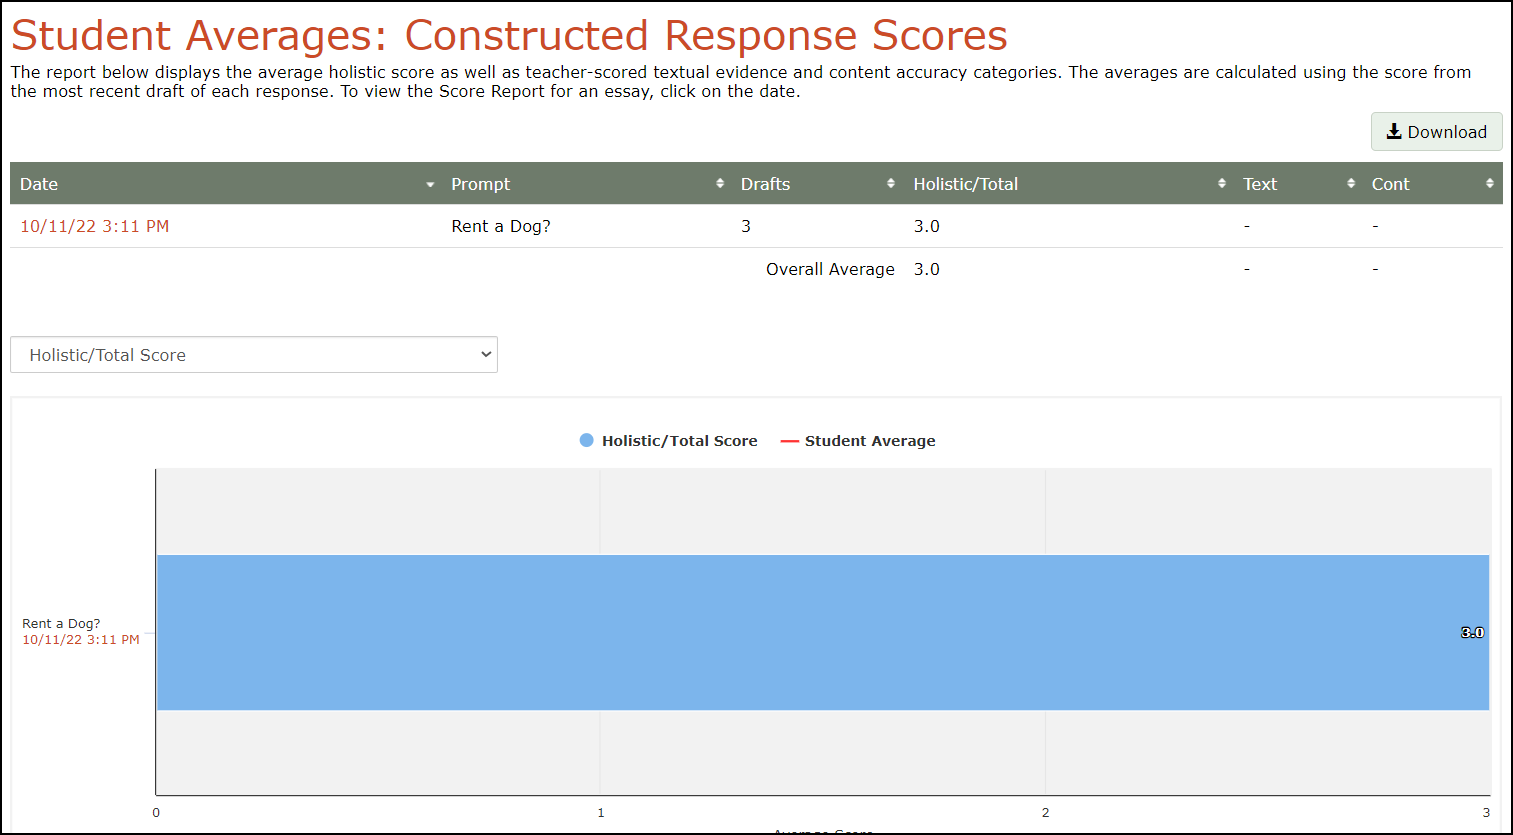
- You can filter the data displayed by clicking on the drop-down menu above the chart and selecting a category.
- Click on an essay's date to display the Score Report.
Click Download in any of the reports to export a customizable report.